
Construction Management
Earned Value Management for Retail Rollouts
Spend records what left the account. What you got for that money is a separate number, and earned value is how you read it. Across a portfolio of stores, the gap between the two is often the earliest warning a budget is in trouble.
How Spend Overstates Progress
The most common cost report on a store project compares budget to invoices. 60% of the budget is committed, so the project reads as roughly 60% along. That inference is the problem. Spend measures what left the account, which tells you little about how much of the work is finished.
The industry track record suggests the inference fails often. The McKinsey Global Institute found that large construction projects typically run up to 80% over budget and take 20% longer than scheduled. KPMG's Global Construction Survey, interviewing senior leaders about the prior three years of delivery, found that only about a third of projects came within 10% of budget, and only a quarter came within 10% of the original deadline. Those are the normal state of an industry that mostly measures cost by looking at what has been paid.
Earned value closes that gap by asking a different question. The question is the budgeted value of the work completed. Once you can answer that, you can measure cost and schedule performance instead of estimating them.
Just Three Numbers Taken at the Same Moment
Earned value has a reputation for bureaucracy it does not deserve at this scale, and stripped down it is three numbers taken at the same moment in time.
Planned value is what you expected to have completed by today, expressed in budget dollars. Earned value is the budgeted cost of the work finished, regardless of what it cost you. Actual cost is what you have spent on that work.
From those three, two ratios do the work. Cost performance is earned value divided by actual cost. Above one, you are getting more work per dollar than planned, and below one you are getting less. Schedule performance is earned value divided by planned value, which tells you whether the work is keeping pace with the plan.
That is the mechanism, and it earns its keep by catching a problem that budget-versus-invoice cannot see at all. A project can look comfortably under budget and still be badly behind. The work has not happened yet. Two months later the same project is over budget and everyone is surprised.
Why the 20% Mark Is the Number That Matters
The strongest argument for measuring early comes from research that has held up for three decades. Studying cost performance across 155 contracts from 44 programs over a 20-year period, David Christensen and Scott Heise found that the cumulative cost performance index was stable from roughly the 20% completion point, and did not vary by more than about 10% from the value it held there.
The finding has a second, less comfortable half. The index tends to decline as the contract proceeds, so the final number can be expected to be worse than what you observed at 20% complete.
Worth stating plainly: that research came out of defense contracts, not retail buildouts, so treat it as directional rather than a retail benchmark. But the direction is the point, and it inverts how most teams behave. The prevailing instinct on a project running hot early is that it will be made up later, in the back half, once the crew hits its stride. The evidence says early performance is predictive, and that waiting for a recovery is the least likely outcome. When a store shows poor cost performance at 20% complete, that reading is already meaningful.
On a rollout, that has a practical consequence. The 20% mark is roughly where intervention is still cheap. By 20% the data is solid while the cheap fixes are still open. You can still swap a vendor, re-sequence a trade, or reset a scope expectation before the number is locked in.
Scaling It Down From the Megaproject Version
Textbook earned value was built for one enormous project with a dedicated controls team. A retail program is the opposite shape: many small, fast, near-identical projects and no controls department. The adaptation is straightforward once you stop trying to run the full apparatus.
Use the schedule you already have as the measurement unit. A store schedule is already a list of deliverables with dates and dependencies. Assign each deliverable a share of the budget, and let a completed deliverable earn its share. You do not need a separate work breakdown structure or a per-activity completion estimate, and you should avoid both. The deliverable is either done or it is not, which removes the judgment call that makes earned value contentious on big jobs.
Then roll it up. The number a director needs is the distribution across the portfolio: which stores are below one, how far, and whether the same vendor or the same market keeps appearing in the bottom quartile. A single project's index is worth a management conversation, but the pattern across 40 stores is what drives a program decision.
- Assign budget to deliverables you already track, rather than building a parallel cost structure
- Earn value on completion, not on an estimated percentage, so the number is not negotiable
- Measure at a fixed cadence, weekly or biweekly, so the trend is readable
- Include committed costs, not just invoiced amounts, or the actual-cost side lags reality by a month
- Report the portfolio distribution, not the portfolio average, since averages hide the stores in trouble
Where Teams Get It Wrong
The failure modes are consistent, and none of them are about the math.
Measuring spend as actual cost while ignoring commitments is the most common. A signed purchase order for long-lead equipment is money gone, whatever the invoice date says. Leave commitments out, and cost performance looks healthy right up until the invoices land and it collapses.
Completion becomes a negotiation next. Once a superintendent can assert that a deliverable is 70% done, earned value turns into a story rather than a measurement, and a binary done-or-not is blunter and more honest.
The index also gets reported without its reason. A cost index of 0.87 only becomes useful once you know why it reads that way, that three change orders landed on the same trade in one month from a vendor you can still swap before the next store. The metric points at a cause without settling what to do about it.
Teams treat the number as a report when it should be a trigger. FMI's 2025 project management study found that only about 2.5% of firms say their projects consistently finish on time and on budget. In that group, a number crossing a threshold reliably makes somebody do something.
Start With One Ratio
You do not need to implement earned value across a portfolio to get most of the value. Pick the projects currently between roughly 20% and 40% complete, assign budget to their existing deliverables, and compute one cost performance ratio for each. That single pass usually surfaces one or two stores that everyone assumed were fine.
The habit worth building is simple. Check cost performance early enough that the answer still changes something, and believe the number when it is unflattering, since a project in trouble at 20% complete rarely talks itself out of it by the end and that reading is the one teams argue themselves out of and later wish they had acted on.
Sources
The benchmarks and research cited in this article come from the following.
- David S. Christensen and Scott R. Heise, Cost Performance Index Stability, on cumulative CPI stability from the 20 percent completion point - https://www.humphreys-assoc.com/uploads/commerce/images/pdf/Christensen_and_Heise_CPI_Stability.pdf
- McKinsey Global Institute, Reinventing Construction: A Route to Higher Productivity (2017) - https://www.mckinsey.com/capabilities/operations/our-insights/reinventing-construction-through-a-productivity-revolution
- KPMG, Global Construction Survey 2015 (Climbing the Curve) - https://assets.kpmg.com/content/dam/kpmg/pdf/2015/05/construction-survey-201502.pdf
- FMI Corporation, 2025 Project Management Study (Why Project Management Still Fails) - https://fmicorp.com/insights/thought-leadership/2025-project-management-study-part-1
The Rollout
The Rollout, in your inbox
A founder's read on retail and multi-site store development. What the latest news means for your pipeline, and what we are building, every couple of weeks.

Written by
Nariman Shariat
Founder, RolloutIQ
Nariman has spent about 20 years opening stores, in the seat between the landlord, the architect, and the general contractor, across some of the largest retail and workplace fleets in the country. Along the way he built the internal platform that ran store development across a fleet, then rebuilt the same idea company after company. He founded RolloutIQ to give multi-site development teams the single source of truth he kept having to build by hand, and writes here about the work of opening and remodeling stores at scale.
More about NarimanKeep Reading
Related Articles
Continue exploring best practices for store development and construction management.

Managing Budgets Across Multiple Construction Sites
Budget management across multiple construction sites requires portfolio-level financial visibility and proactive cost controls. Here is how leading operators do it.

A Store Rollout Budget Should Be a Governed Baseline
The budget for a store project covers six cost families, not just construction, and the hard part of all of it is governance rather than arithmetic. Here is what it means to run the whole project budget as a baseline.
The Cost Code Structure That Makes a Retail Portfolio Comparable
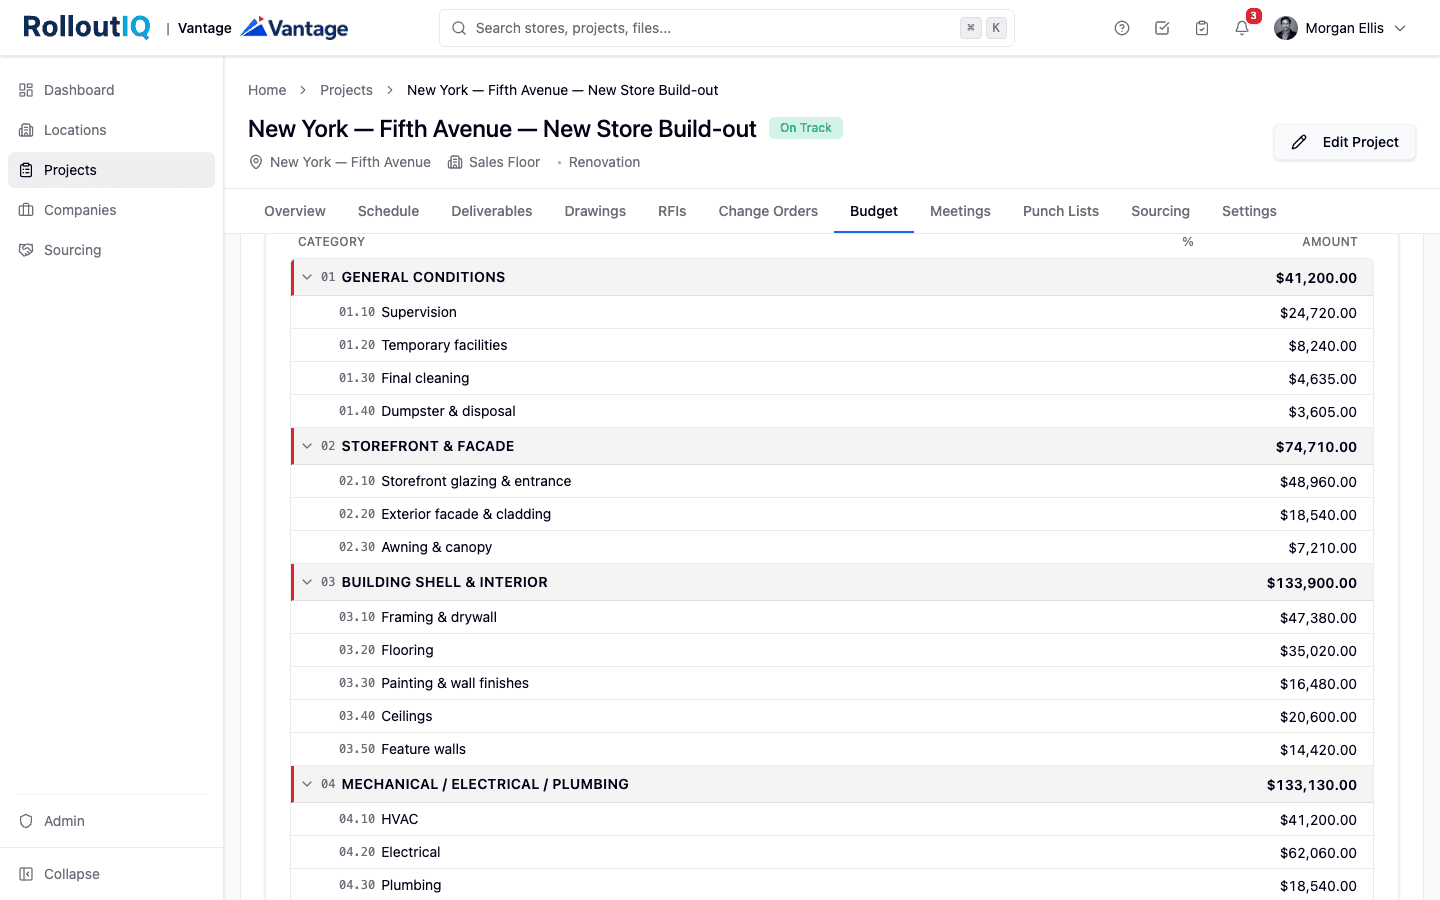
When every project's budget is a different spreadsheet, nothing rolls up and no two stores compare. A shared chart of cost categories and families is what makes a multisite portfolio answerable to one question. What does a store cost.
Ready to Build Smarter?
See how RolloutIQ™ can streamline your retail and multi-site rollout program. Book a personalized demo with our team.