
Portfolio Explorer
Every Project in One Live Spreadsheet
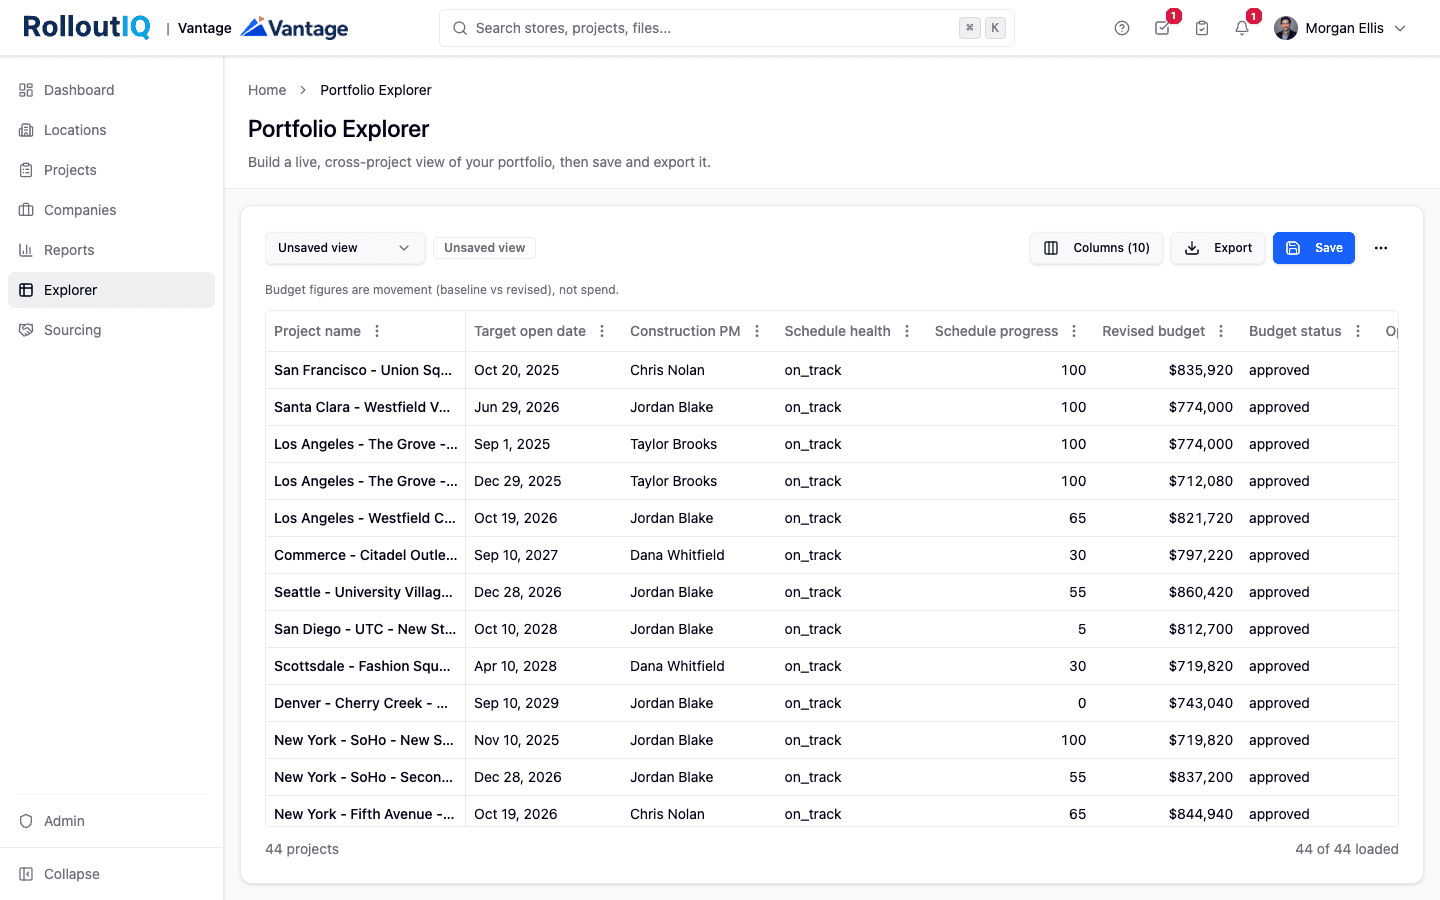
Portfolio owners keep a master tracker in Smartsheet or Excel, and the copy drifts from reality the moment it is saved. Portfolio Explorer keeps that rollup live and inside RolloutIQ™. Pick the columns you want across projects, schedule, budget, team, and open work, then filter, group, save the view, and export it. One row is one project, so the whole portfolio reads as a single flat list.
The Problem
Why the Portfolio Rollup Goes Stale
A rollup built in a side spreadsheet goes stale fast, and rebuilding it by hand is a weekly tax on the people who should be running the projects.
The Rollup Lives Outside the System
The master tracker sits in Smartsheet or a spreadsheet, cut off from where the work happens. Every project update has to reach it by hand, so it is wrong within a day.
Re-keying Eats the Week
Building the board pack means copying status, dates, and budgets out of dozens of project pages into a grid. Across a team that is hours of assembly work every week.
The Numbers Stop Matching
When the side spreadsheet and the platform disagree, leadership argues about which figure is right instead of what to do about it.
What RolloutIQ™ Does
What Portfolio Explorer Does
Choose the columns your review needs, and RolloutIQ™ builds the grid live from the data your team already keeps. What each person sees is scoped to what they are allowed to open.
One Row Per Project, Columns You Choose
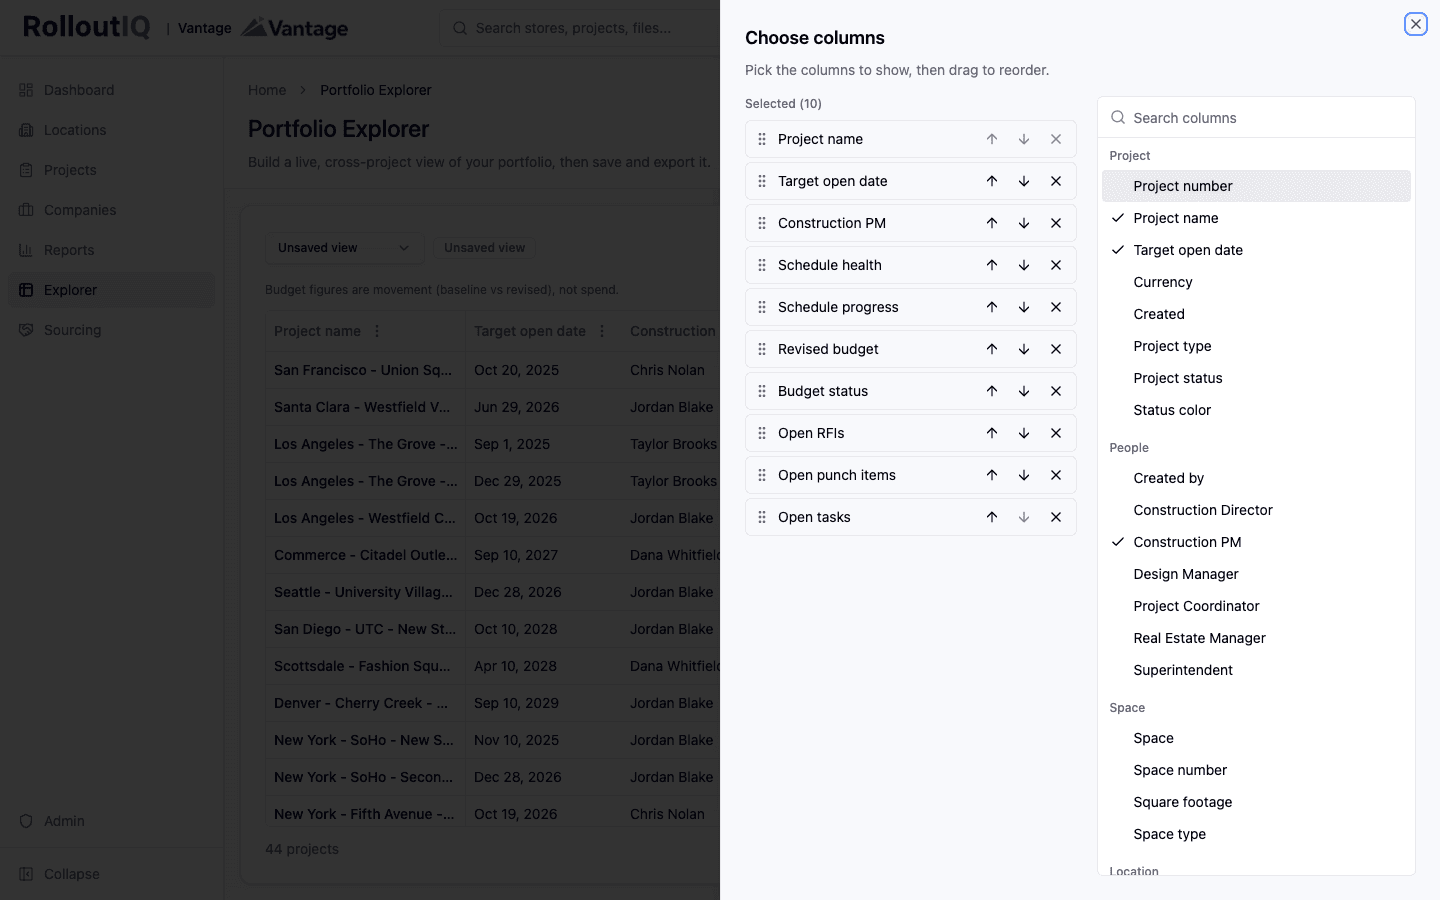
A column catalog spanning project, space, location, brand, region, budget, schedule, team, and per-module open-work counts. Pick what belongs in the view and drag the columns into the order you want.
A Column for Any Date or Role
Add a start and an end date column for any deliverable in the schedule, so every project's construction start lines up side by side. Add a person column for a project role such as Project Manager, and it resolves to whoever holds that seat.
Schedule Progress and Risk at a Glance
A completion percentage and the schedule risk for each project, the same On Track, At Risk, or Off Track level the project page shows, overrides included.
Open Work, Scoped to Access
Open task, RFI, and punch counts and change-order totals per project. Each count appears only where the viewer has that module, and only for the rows they are allowed to see.
Filter, Group, and Sort the Whole Portfolio
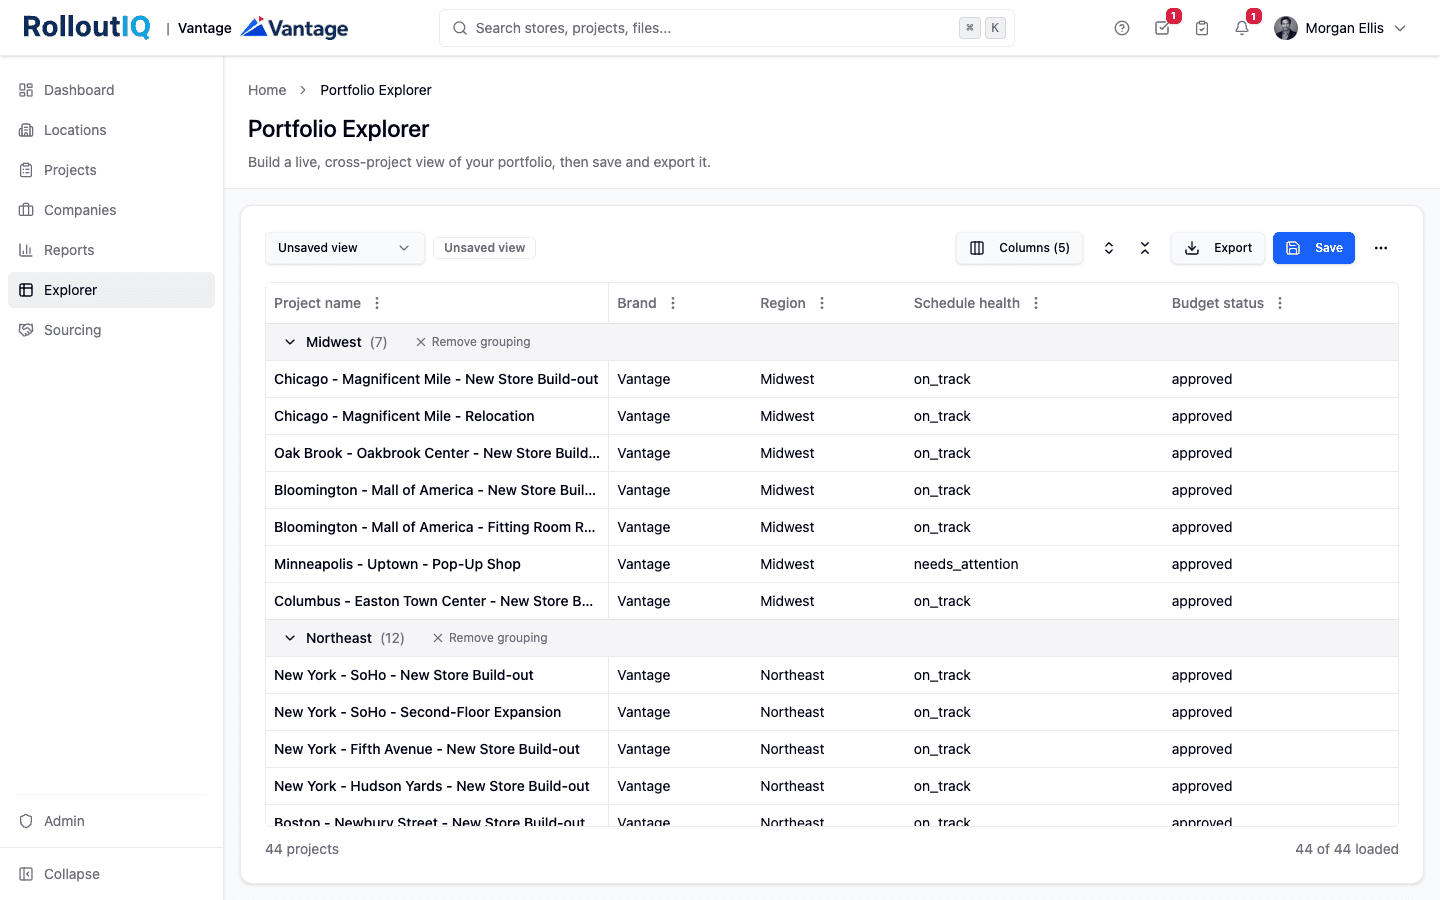
Narrow the grid with filter chips, group it into collapsible sections with counts, and sort by any column. Filtering runs across the whole portfolio, not just the rows on screen.
Saved Views, Personal or Shared
Save a layout as your own or share it with the team. A shared view carries the columns and filters, and each person still sees only the projects they can open. Seeded starter views load on your first visit.
Export to Excel
Export the view in front of you, filters and all, as a formatted workbook. It is prepared in the background, and a notification tells you when it is waiting in My exports.
Budget Movement, Read Honestly
Money columns show the approved baseline against the current revised figure in each project's own currency, so you see how a budget has moved. RolloutIQ™ holds no invoice or payment data, so these figures are not spend.
Highlights
Build the View, Read the Portfolio
Pick columns from a grouped catalog, then group and filter the grid until it answers the question in front of you.
Pick exactly the columns you need
Search or browse a catalog grouped by where each column comes from, check what belongs in the view, and drag to reorder. A view holds up to 50 columns.
Group the portfolio any way
Group by schedule risk, region, brand, or any other column into collapsible sections with a count on each header, collapsing a hundred projects into a handful of groups.
In Practice
How Portfolio Teams Use It
Monday Review in One Click
Load a saved view, filter to the region on the agenda, and export a board-ready spreadsheet before the call starts, rather than rebuilding it over the weekend.
Find Every Project That Is Behind
Filter schedule risk to Off Track and narrow it to one manager to see what is slipping and who holds it across the whole portfolio.
Retire the Parallel Tracker
The side spreadsheet that went stale every week goes away. The rollup lives in the system of record and updates itself as the work does.
For franchise groups
A franchisor update in one export
Save a view filtered to one brand with the agreement deadline beside each planned opening. When that franchisor's development team asks where things stand, export it to Excel and send it.
See RolloutIQ for franchise groupsFAQ
Portfolio Explorer FAQ
No. Money columns show budget movement, the approved baseline against the current revised figure, in each project's own currency. RolloutIQ™ holds no invoice, commitment, or payment data, so the figures are not actual spend, and currencies are not converted between projects.
Yes. A shared view shares the layout, its columns, filters, grouping, and sort, and not the data. Each person who opens it still sees only the projects their access allows, so a shared view never leaks a project.
The whole portfolio, one row per project, in a single flat list. There is no row ceiling, so the entire book of work stays together in one place.
See Your Whole Portfolio as a Spreadsheet
Book a demo to build a live cross-project view, save it, and export it, on your real store-development data.